Original Article

Interim FDG-PET in Diffuse Large B-Cell Non-Hodgkin's Lymphoma: A Meta-Analysis
1Mubarak M. Al-Mansour, 1Meteb Al-Foheidi, 2Ghieth A Kazkaz, 2Ezzeldin M. Ibrahim
1Princess Noorah Oncology Center, King Abdulaziz Medical City, P.O.BOX 9515, Jeddah 21423, Kingdom of Saudi Arabia2Oncology Center of Excellence, International Medical Center, PO Box 2172, Jeddah 21451, Kingdom of Saudi ArabiaThis is an Open Access article distributed under the terms of the Creative Commons Attribution License (http://creativecommons.org/licenses/by/3.0), which permits unrestricted use, distribution, and reproduction in any medium, provided the original work is properly cited.Submitted: August 1, 2013; Accepted: August 15, 2013; Published October 17, 2013
Abstract
Background
FDG-PET is increasingly being used in non-Hodgkin’s lymphoma (NHL), however, the value of interim FDG-PET (IFDG-PET) performed during induction chemotherapy is not established. A meta-analysis was designed to define the clinical utility of IFDG-PET.
Methods
According to predefined selection criteria, literature search identified 22 studies included in the analyses.
Results
There were 1,957 patients (median age of 55 years, 58% males, 95% diffuse large B-cell, 36% stage I/II, and 64% stage III/IV). Patients with negative IFDG-PET had 62% reduction in the risk of disease progression (hazard ratio [HR] = 0.38; 95% CI, 0.30–0.47; P <0.0001) and 72% mortality reduction (HR = 0.28; 95% CI, 0.21–0.38; P <0.0001) as compared with those with positive IFDG-PET. IFDG-PET predicted survival regardless of the number of chemotherapy (CTX) cycles prior to interim assessment. Meta-regression analysis demonstrated that higher study quality score, increasing median age, increasing number of prior CTX cycles, and longer follow-up were associated with more favorable progression-free survival (PFS). Moreover, visual methods were more related to lower HRs as compared with quantitative/semi-quantitative (Q/SQ) interpretation techniques. IFDG-PET demonstrated moderate sensitivity and specificity for predicting PFS (61.8% and 66.0 %, respectively), and overall survival (62.0% and 63.0%, respectively), with visual image interpretations outperforming Q/SQ methods. The meta-analysis showed several limitations attributed to studies quality and to interpretation methods.
Conclusion
The current meta-analysis demonstrated the predicting utility of IFDG-PET. Future studies should use standardized imaging parameters and examine the effect of using IFDG-PET results on adaptive induction therapy.
Key Words
Non-Hodgkin’s lymphoma; FDG-PET; Interim; Prediction; Prognosis.
Introduction
Positron emission tomography (PET) is a rapidly growing imaging technique for the diagnosis and staging of many types of cancer [1, 2]. It has also been shown that whole body 18F-fluoro-2-deoxy-D-glucose (FDG)-PET has the ability to detect small tumor deposits with a diagnostic accuracy beyond conventional imaging modalities. At present, many diagnostic and therapeutic decisions, and prognostication in daily oncology practice are based on the complimentary role of this tool to the well-established imaging methods.
For nearly three decades, standard imaging modalities have been used as the primary imaging tools to assess lymphoma. In recent years, however, FDG-PET is increasingly being used in non-Hodgkin’s lymphoma (NHL) for determining staging, evaluating treatment response, and predicting final outcome. Two meta-analyses for patients with aggressive NHL have reinforced the prognostic utility of FDG-PET performed at the end of the planned management [3, 4]. The most recent International Working Group (IWG) response criteria incorporate FDG-PET in the definitions of response in NHL and Hodgkin's lymphoma (HL) [5], using standards established by the International Harmonization Project for Response Criteria in Lymphoma to interpret end of therapy FDG-PET scans as positive or negative [6].
On the other hand, contrary to the overwhelming evidence in HL [7-9], the value of interim FDG-PET (IFDG-PET) performed during the course of induction chemotherapy for NHL is not well established. Some studies have confirmed a significant predicting utility [10-14], while others failed to demonstrate such benefit [15, 16]. One of the possible reasons for the conflicting results may be related to the details of FDG-PET data acquisition and assessment [17]. Moreover, studies that addressed the predictive value of IFDG-PET in NHL were very heterogeneous with respect to patient characteristics, lymphoma subtypes, chemotherapy regimens, heterogeneity of the visual criteria used, image reconstruction, methodology of data acquisition, timing of IFDG-PET, criteria used to interpret the scans, and data analysis.
To the best of our knowledge, there is no recently published meta-analysis that examined the predictive role IFDG-PET for patients with diffuse large B-cell (DLBC) NHL. The lack of such data and the contradictory outcome of reported studies have prompted the current meta-analysis.
Material and Methods
Search Strategy
We identified studies of interest published between January 2000 and February 2013 by first conducting an electronic literature search of the MEDLINE, EMBASE, and the Cochrane Library databases. We also searched for relevant abstracts in annual conference proceedings published during the same time period for the American Society of Clinical Oncology and the European Society for Medical Oncology.
We used exploded Medical Subject Heading terms or keywords ‘‘lymphoma,’’ and ‘‘non-Hodgkin.’’ The terms were combined with “positron emission tomography,” “18F-2-deoxy-2-fluoro-D-glucose PET (FDG-PET)”, and “PET.” Search results were also filtered against the terms “interim” or “early.” In the second step, these keywords were combined using the Boolean operator ‘‘and’’ with ‘‘prognosis,” “survival”, or “prediction.”
Selection Criteria
We included studies that met all of following criteria: (1) published in the English language between January 2000 and February 2013; (2) included patients at any age and with any stage of predominantly DLBC NHL;(3) investigated the prognostic value of interim FDG-PET regardless of the number of chemotherapy cycles given prior to evaluation; (4) reported PFS and/or OS outcome versus interim FDG-PET results or having enough data and/or survival curves to allow such outcomes and its hazard ratios (HRs) to be estimated; and (5) published as original articles (no case reports, case series, reviews, comments, letters, or editorials).
When two or more articles reported duplicate data, we included only the most recent data, the study with the longer follow-up, or the most relevant study. Studies that mainly included patients with extra-nodal NHL or those intended to examine the diagnostic utility FDG-PET in detecting bone marrow involvement were excluded. We also excluded studies that mainly included lymphoma histological types other than DLBC.
Data Extraction
Three authors (MMA, MA, GAK) independently inspected each item identified by the search and applied the inclusion criteria. For potentially relevant articles and in cases of disagreement between reviewers, the full article was reviewed by all authors. The data intended for extraction were discussed and decisions were documented. As described by Isasi et al. [18], we used the criteria for study quality reported by Gould et al. [19] and the Society of Nuclear Medicine Guidelines for performing FDG-PET studies [20]. The criteria used for assessing study quality are listed in Suppl. 1.
A standardized Microsoft Excel sheet was used to abstract data for each study that fulfilled the inclusion criteria. Extracted data included study characteristics (first author’s last name, publication year, study design, number of NHL patients, sex distribution, mean/median age of patients, stage distribution, mean/median duration of follow-up, technical characteristics of FDG-PET, method of image interpretation (qualitative or quantitative/semi-quantitative [Q/SQ]), and survival data including retrieved or calculated HRs. We calculated unreported HRs and its 95% confidence interval (CI) using the procedure proposed by Tierney et al. [21], that is based on the method reported by Parmar et al. [22].
We also extracted or calculated IFDG-PET sensitivity, specificity, positive predictive value (PPV), negative predictive value (NPV), and positive and negative likelihood ratios (LR). Positive LR is the ratio of the proportion of patients who have the target condition (progression or death) and positive IFDG-PET to the proportion of patients without the target condition who also test positive. Negative LR is the ratio of the proportion of patients who have the target condition (progression or death) and negative IFDG-PET to the proportion of patients without the target condition who also test negative [23]. In addition, we estimated the pooled values of these test performance parameters. Moreover, summary receiver operating characteristics (ROCs) were computed using random effects methods [20]. We calculated the maximum joint sensitivity and specificity, Q*, as an overall measure of diagnostic accuracy (the point on the ROC curve at which the sensitivity and specificity are equal) [24]. Studies that did not provide sufficient data to permit estimating relevant parameters were excluded from statistical pooling. We added 0.5 to a cell frequency of zero to calculate the estimates.
Outcome Measures
The primary outcome was the pooled HR for the 2-year progression-free (PFS) and overall survival (OS) for patients with negative IFDG-PET versus those with positive results. We elected to use the 2-year survival rates to attain homogeneity of survival analysis. For studies that did not report that data, the 2-year survival rates were calculated as described earlier. The predictive role of IFDG-PET was also examined against the methods of image interpretation. For studies that have used more than one IFDG-PET interpretation method, each data set was considered as a separate study. The secondary outcome was the test performance of IFDG-PET.
Statistical Analyses
We assessed the heterogeneity of the results by inspecting graphical presentations and by calculating a X2 test of heterogeneity and the I2 statistic of inconsistency [25, 26]. Statistically significant heterogeneity was defined as a X2 P value less than 0.1 or an I2 statistic greater than 50%. The pooled estimates of HR, together with associated 95% CI, were obtained using the Der Simonian and Laird random-effects model[8], or the Mantel–Haenszel fixed-effects model [9], where appropriate. We performed meta-regression analysis to determine to what extent the effects of clinical variable could explain any demonstrated heterogeneity. The dependent variable was the ln HR weighted for the inverse of variance to perform weighted least-square linear regression. We first conducted a univariate regression analysis for each variable followed by a multivariate regression analysis including only variables found significant in the univariate analysis. Where appropriate, we assumed the data to be missing at random; therefore, observed study characteristics were used to impute missing data by means of multiple imputations [27].
Subgroup analyses were performed to assess potential contributions of various clinical variables to the main outcomes. A funnel plot estimating the precision of trials (plots of logarithm of the HR against the sample size) was examined for asymmetry to determine publication bias [28]. Publication bias was also quantified by the regression asymmetry test by Egger[28] .
All statistical tests were two-sided. HR was estimated according to the inverse of variance method with the use of Comprehensive Meta-analysis Software version 2.2.064 (Biostat, Englewood New Jersey, USA). We also used SPSS to construct ROC curves and estimate Q* (IBM SPSS Statistics for Windows, version 20.0. Armonk, New York, USA). Where appropriate, we also used the built-in calculator of the Review Manager for Windows software version 5.2.3 (The Cochrane Collaboration, Oxford, UK) to compute relevant data.
Results
We identified 1,191 potentially relevant articles (Figure 1). Three studies were excluded as they included patients with HD and NHL without separable analysis of each entity [29-31]. After exclusion of duplicate references, nonrelevant literature, and those that did not satisfy the inclusion criteria, 22 candidate articles were considered for the meta-analysis [10-13, 15, 16, 32-47]. Tables 2, and 3 and Suppl. 1, show the abstracted and computed data of the included studies. The data sets included studies reported between 2000 and 2013. There were 1,957 patients and of those with known gender distribution; there were 1,182 (58%) males and 839 (42%) females. The median age was 55 years (95% CI, 48.8-64.1 years). Most patients had DLBC NHL (1,855, 95%). Of 1,840 patients with known disease stage, 668 (36%) and 1,172 (64%) patients had stage I/II and stage III/IV, respectively. The median duration of follow-up was 28.1 months (95% CI, 26.1-36.4 months). IFDG-PET was performed after a minimum of 2 chemotherapy (CTX) cycles to a maximum of 6. Visual, Q/SQ only, or both methods were used in 15 (68%), 3 (14%), and 4 (18%) studies, respectively.
Figure 1
Flowchart of Literature Search and the Selection of the 22 Included Studies
Table 1
Criteria for Assessing Study Quality
|
Technical quality of FDG-PET
|
|
Spatial resolution < 11 mm
FDG uptake period ≥ 30 min
FDG dose ≥ 10 mCi
Acquisition time for emission
scan specified
Attenuation correction performed
Participants with hyperglycemia
excluded
Participants studied in the
fasting state
Positive test results defined
according to specific criteria
|
|
Technical quality and
application of the reference test or tests
|
|
Description of reference
standard
|
|
Independence of test
interpretation
|
|
FDG-PET readers blinded to the
results of the reference test or tests
|
|
Clinical characteristics of the
study sample described
|
|
Age, gender, and number of
patients enrolled, reason for performing FDG-PET
|
|
Cohort assembly
|
|
Participants enrolled
prospectively
Individual patient used as unit
of data analysis
|
FDG-PET = 18F-2-deoxy-2-fluoro-D-glucose positron emission
tomography; mCi = millicuries
Studies Quality
Of an optimal quality score of 14 (Suppl. 1), the median score for the included studies was 9 (ranging, 3 to 12). While 14 (64%) of the included studies were prospective [10, 11, 13,16, 32, 34-41, 45], in only 3 (15%) studies [16, 33, 37], patients management was adapted according to the results of IFDG-PET. In 10 studies (50%), evaluators of IFDG-PET were blinded from the clinical outcomes (13, 32, 34, 37-39, 41-44).
Suppl. 1:
Clinical Characteristics of the 22 Included Studies
|
Study
|
Study Description
|
Interpretation of IFDG-PET
|
No. Pre IFDG-PET CTX
Cycles
|
Quality
met (optimal = 14)
|
No.
|
Median Age (Yeas)
|
Males No. (%)
|
Females No. (%)
|
Stage I/II
No. (%)
|
Stage III/IV
No. (%)
|
Median Follow-up (Months)
|
|
Jerusalem 2000
11
|
Prospective, adult pts. (DLBC: 57%)
|
Visual
|
3
|
10
|
28
|
61
|
14 (50)
|
14 (50)
|
8 (29)
|
20 (71)
|
17.5
|
|
Spaepen 2002
10
|
Prospective, adult pts. (DLBC: 76%)
|
Visual
|
3 to 4
|
8
|
70
|
50
|
52 (74)
|
18 (27)
|
22 (31)
|
48 (69)
|
36.9
|
|
Haioun 2005
13
|
Prospective, adult pts. (DLBC: 94%)
|
Visual
|
2
|
12
|
90
|
53
|
56 (62)
|
34 (38)
|
9 (10)
|
81 (90)
|
24
|
|
Mikhaeel 2005
12
|
Retrospective, adult pts. (DLBC: 52%)
|
Visual
|
2 to 3
|
7
|
121
|
55
|
65 (54)
|
56 (46)
|
76 (63)
|
45 (37)
|
24.4
|
|
Fruchart 2006
32
|
Prospective, adult pts. (DLBC: 88%)
|
Visual
|
2 to 3
|
12
|
40
|
56
|
27 (68)
|
13 (32)
|
13 (33)
|
27 (67)
|
22
|
|
Trneny 2006
33
|
Retrospective, adult pts. (DLBC: 100%)
|
Visual
|
2-4
|
3
|
84
|
NR
|
NR
|
NR
|
NR
|
NR
|
30
|
|
Dupuis 2009
34
|
Prospective, adult pts. (DLBC: 100%)
|
Visual
|
4
|
10
|
103
|
53
|
70 (68)
|
33 (32)
|
13 (13)
|
90 (87)
|
53
|
|
Halasz 2012
35
|
Prospective, adult pts. (DLBC: 92%)
|
Visual
|
NR
|
9
|
59
|
45
|
31 (52)
|
28 (48)
|
49 (83)
|
10 (17)
|
46.5
|
|
Itti 2010
36
|
Prospective, adult pts. (DLBC: 100%)
|
Q/SQ
|
2
|
8
|
92
|
54
|
60 (65)
|
32 (35)
|
11 (12)
|
81 (88)
|
42
|
|
Moskowitz 2010
16
|
Prospective, adult pts. (DLBC: 100%)
|
Visual
|
4
|
6
|
98
|
47
|
57 (58)
|
41 (42)
|
15 (15)
|
83 (85)
|
44
|
|
Casasnovas 2011
37
|
Prospective, adult pts. (DLBC: 100%)
|
Visual and Q/SQ
|
2 and 4
|
8
|
113
|
46
|
66 (58)
|
47 (42)
|
4 (4)
|
109 (96)
|
19
|
|
Cashen 2011
38
|
Prospective, adult pts. (DLBC: 100%)
|
Visual
|
2
|
11
|
50
|
58
|
NR
|
NR
|
0 (0)
|
50 (100)
|
33.9
|
|
Yang 2011
39
|
Prospective, adult pts. (DLBC: 100%)
|
Visual
|
3 to 4
|
12
|
161
|
61
|
94 (58)
|
67 (42)
|
94 (58)
|
67 (42)
|
30
|
|
Yoo 2011
40
|
Prospective, adult pts. (DLBC: 100%)
|
Visual
|
|
9
|
155
|
56
|
87 (56)
|
68 (44)
|
68 (44)
|
87 (56)
|
20
|
|
Zinzani 2011
46
|
Retrospective, adult pts. (DLBC: 100%)
|
Visual
|
3 to 6
|
8
|
91
|
54
|
48 (53)
|
43 (47)
|
30 (33)
|
61 (67)
|
50
|
|
Bakhshi 2012
41
|
Prospective, pediatrics pts. (non-
lymphoblastic: 100%)
|
Q/SQ
|
2
|
11
|
34
|
10.5
|
30 (88)
|
4 (12)
|
3 (9)
|
31 (91)
|
20.3
|
|
Park 2012
42
|
Retrospective, adult pts. (DLBC: 100%)
|
Q/SQ
|
2 to 3
|
7
|
100
|
55
|
56 (56)
|
44 (44)
|
55 (55)
|
45 (45)
|
21
|
|
Pregno 2012
15
|
Retrospective,
adult pts. (DLBC: 100%)
|
Visual
|
2 to 4
|
8
|
88
|
55
|
41 (47)
|
47 (53)
|
29 (33)
|
59 (67)
|
26.2
|
|
Safar 2012
43
|
Retrospective,
adult pts. (DLBC: 100%)
|
Visual and Q/SQ
|
2
|
9
|
112
|
59
|
75 (67)
|
37 (33)
|
40 (36)
|
72 (64)
|
38
|
|
Yang 2012
44
|
Retrospective,
adult pts. (DLBC: 100%)
|
Visual and Q/SQ
|
3 to 4
|
12
|
186
|
61
|
106 (57)
|
80 (43)
|
95 (51)
|
91 (49)
|
22.8
|
|
Fuertes 2013
45
|
Prospective, adult
pts. (DLBC: 100%)
|
Visual and Q/SQ
|
2 to 3
|
9
|
50
|
55
|
28 (56)
|
22 (44)
|
28 (56)
|
22 (44)
|
46.8
|
|
Ying 2013
47
|
Prospective, adult
pts. (DLBC: 100%)
|
Visual
|
2
|
9
|
32
|
NR
|
20 (63)
|
12 (37)
|
9 (28)
|
27 (72)
|
16.7
|
DLBC = diffuse large
B-cell; CTX = chemotherapy; IFDG-PET = interim 18F-2-deoxy-2-fluoro-D-glucose
positron emission tomography; NR = not reported; pts. = patients; Q/SQ =
quantitative/semi-quantitative.
Table 2
Predictive Utility of IFDG-PET of the 2-Year Progression-Free Survival
|
Study
|
IFDG-PET Method
|
Progression-Free Survival %
|
Hazard Ratio
(95% CI)
|
|
IFDG-PET -ve
|
IFDG-PET +ve
|
|
Jerusalem 2000
11
|
Visual
|
75.0
|
0.00
|
0.25 (0.12 – 0.52)
|
|
Spaepen 2002
10
|
Visual
|
85.3
|
3.0
|
0.15 (0.05 – 0.45)
|
|
Haioun 2005
13
|
Visual
|
82.0
|
53.0
|
0.32 (0.17 – 0.60)
|
|
Mikhaeel 2005
12
|
Visual
|
52.0
|
24.0
|
0.55 (0.39 – 0.78)
|
|
Fruchart 2006
32
|
Visual
|
85.0
|
30.0
|
0.21 (0.08 – 0.58)
|
|
Trneny 2006 +Rx
33
Trneny 2006 –Rx
33/sup>
|
Visual
Visual
|
96.0
82.0
|
58.0
10.0
|
0.10 (0.02 – 0.50)
0.20 (0.11 – 0.36)
|
|
DDupuis 2009
34
|
Visual o:p>
|
85.0
|
30.0
|
0.21 (0.07 – 0.63)
|
|
HHalasz 2012
35/sup>
|
Visual
|
100.0
|
90.0
|
0.08 (0.00 – 6.40)
|
|
IItti 2010
36/sup>
|
SUVmax 120%
SUVmax 168 %
|
76.0
80.2
|
65.1
48.1
|
0.64 (0.31 – 1.33)
0.38 (0.21 – 0.69)
|
|
MMoskowitz 2010
16
|
Visualo:p>
|
92.0
|
78.0
|
0.36 (0.13 – 1.02)
|
|
CCasasnovas 2011
37
|
Visual – 2 cycleso:p>
SUVmax 66% - 2
cycles
Visual – 4 cycles
SUVmax 70% 4-
cycles
|
73.0
77.0
81.0
83.0
|
77.0
57.0
73.0
40.0
|
1.17 (0.54 – 2.55)
0.53 (0.26 – 1.09)
0.70 (0.34 – 1.46)
00.28 (0.14 – 0.57)
|
|
Cashen 2011
38
|
Visualo:p>
|
85.0
|
63.0
|
0.41 (0.14 – 1.18)
|
|
YYang 2011
39
|
Visual o:p>
|
90.0
|
38.0
|
0.18 (0.12 – 0.27)
|
|
YYoo 2011
40/sup>
|
Visual
|
88.0
|
72.0
|
0.43 (0.22 – 0.85)
|
|
ZZinzani 2011
46/sup>
|
Visual
|
95.0
|
48.0
|
0.10 (0.03 – 0.31)
|
|
BBakhshi 2012
41/sup>
|
SUV
|
85.7
|
57.0
|
0.33 (0.08 – 1.35)
|
|
PPark 2012
42/sup>
|
SUVmax
SUVsum
|
NR
NR
|
NR
NR
|
0.86 (0.75 – 0.97)
0.93 (0.89 – 0.97)
|
|
PPregno 2012
15
|
Visual o:p>
|
85.0
|
72.0
|
0.54 (0.23 – 1.27)
|
|
SSafar 2012
43/sup>
|
Visual
SUVmax 66%
|
87.0
80.0
|
50.0
50.0
|
0.26 (0.13 – 0.51)
0.40 (0.19 – 0.84)
|
|
YYang 2012
44/sup>
|
Visual
SUVmax 91.8%
MTV2.5 99.3%
|
84.0
95.0
84.0
|
62.0
70.0
66.0
|
0.35 (0.17 – 0.72)
0.25 (0.12 – 0.54)
0.45 (0.26 – 0.78)
|
|
FFuertes 2013
45
|
Visualo:p>
Visual
SUVmax 76%
|
78.0
85.0
95.0
|
75.0
45.0
54.0
|
0.88 (0.30 – 2.59)
0.27 (0.11 – 0.67)
0.22 (0.07 – 0.69)
|
|
YYing 2013
47/sup>
|
Visual
|
88.0
|
82.0
|
0.67 (0.12 – 3.67)
|
++Rx = additional treatment given; - Rx =
no additional treatment; +ve = positive; -ve = negative; CI = confidence
interval; IFDG-PET = interim 18F-2-deoxy-2-fluoro-D-glucose positron emission
tomography; SUVmax = maximum standardized uptake value reduction; SUVsum = sum
of maximum standardized uptake value reduction;
Routine biopsy of residual disease based on positive IFDG-PET was mandated in two studies. In the study reported by Moskowitz et al. [16], 38 patients with a positive IFDG-PET underwent biopsy that was negative in 33 (87%). The authors reported that PFS was identical for patients with positive IFDG-PET and negative biopsy compared with IFDG-PET negative patients. In the second study, 10 patients who had a positive IFDG-PET after 4 cycles of CTX underwent a biopsy of the residual hypermetabolic mass, and in only 2 patients (20%) the biopsy showed an active disease [37].
Table 3
Predictive Utility of IFDG-PET of the 2-Year Overall Survival
|
Study
|
IFDG-PET Method
|
Overall Survival %
|
Hazard Ratio
(95% CI)
|
|
IFDG-PET -ve
|
IFDG-PET +ve
|
|
Jerusalem 2000
11
|
Visual
|
80.0
|
0.00
|
0.20 (0.09 – 0.45)
|
|
Spaepen 2002
10
|
Visual
|
84.0
|
40.0
|
0.10 (0.03 – 0.35)
|
|
Haioun 2005
13
|
Visual
|
90.0
|
61.0
|
0.26 (0.10 – 0.65)
|
|
Mikhaeel 2005
12
|
Visual
|
82.0
|
73.0
|
0.67 (0.32 – 1.40)
|
|
Fruchart 2006
32
|
Visual
|
84.0
|
36.0
|
0.25 (0.10 – 0.61)
|
|
Trneny 2006 +Rx
33
Trneny 2006 –Rx
33/sup>
|
Visual
Visual
|
92.0
98.0
|
38.0
74.0
|
0.13 (0.05 – 0.34)
0.08 (0.01 – 0.64)
|
|
CCasasnovas 2011
37
|
Visual – 2 cycleso:p>
SUVmax 66% - 2
cycles
Visual – 4 cycles
SUVmax 70% - 4
cycles
|
93.0
93.0
94.0
94.0
|
84.0
60.0
83.0
50.0
|
0.44 (0.10 – 1.94)
0.17 (0.06 – 0.49)
0.35 (0.10 – 1.22)
0.12 (0.04 – 0.36)
|
|
YYang 2011
39/sup>
|
Visual
|
92.0
|
48.0
|
0.25 (0.16 – 0.39)
|
|
YYoo 2011
40/sup>
|
Visual
|
89.0
|
75.0
|
0.44 (0.21 – 0.92)
|
|
ZZinzani 2011
46/sup>
|
Visual
|
100.0
|
69.0
|
0.03 (0.01 – 0.09)
|
|
BBakhshi 2012
41
|
SUVo:p>
|
78.6
|
50.4
|
0.43 (0.14 – 1.32)
|
|
PPark 2012
42/sup>
|
SUVmax
SUVsum
|
NR
NR
|
NR
NR
|
0.87 (0.77 – 0.98)
0.95 (0.91 – 0.99)
|
|
SSafar 2012
43
|
Visualo:p>
SUVmax 66%
|
90.0
87.0
|
60.0
62.0
|
0.25 (0.11 – 0.56)
0.34 (0.13 – 0.88)
|
|
FFuertes 2013
45/sup>
|
Visual – 3-point
Visual – 5-point
SUVmax 76%
|
88.0
92.0
87.5
|
65.0
50.0
72.0
|
0.30 (0.04 – 2.24)
0.11 (0.03 – 0.42)
0.17 (0.04 – 0.75)
|
+Rx = additional treatment given; - Rx =
no additional treatment; +ve = positive; -ve = negative; CI = confidence
interval; IFDG-PET = interim 18F-2-deoxy-2-fluoro-D-glucose positron emission
tomography; SUVmax = maximum standardized uptake value reduction; SUVsum = sum
of maximum standardized uptake value reduction.
Risk of Bias
The funnel plot of studies that used visual IFDG-PET for interpreting imaging results showed no asymmetry, and the Egger linear regression test was not significant (P = 0.83), indicating no evidence of significant publication bias. On the contrary, for studies used Q/SQ methods, there was an asymmetry of the funnel plot, and the P value of Egger test was 0.001, signifying publication bias.
Table 4 Results of the
Multivariate Meta-Regression Analyses (Random Effects Models)
|
Model
|
Model R2
|
Covariates
|
Meta-Regression β Coefficient (SE)
|
P Value
|
|
PFS
|
|
|
|
|
|
Pooled hazard ratio
|
0.84
|
Study quality
Visual vs. quantitative IFDG-PET
Median age
Number of prior CTX
Follow-up
|
- 0.12 (0.03)
0.42 (0.13)
- 0.02 (0.007)
- 0.23 (0.10)
- 0.03 (0.01)
|
0.001
0.01
0.03
0.03
0.004
|
|
OS
|
|
|
|
|
|
Pooled hazard ratio
|
0.82
|
Visual vs. quantitative IFDG-PET
Ratio Stage III/IV to I/II
|
1.19 (0.19)
- 0.05 (0.20)
|
<0.0001
0.022
|
CTX = chemotherapy; IFDG-PET = interim 18F-2-deoxy-2-fluoro-D-glucose positron
emission tomography; SE = standard error.
Pooled HRs for Predicting PFS
The fixed effects model for the 2-year PFS showed significant heterogeneity (I2 statistic = 86.9%; P <0.0001); therefore, the random-effects model was computed and it showed that patients with negative IFDG-PET had 62% reduction in the risk of disease progression compared with those with positive scans (HR = 0.38; 95% CI, 0.30–0.47; P <0.0001) href="#fig2">(Fig. 2). Moreover, in a random effects model, both visual and Q/SQ IFDG-PET methods significantly predicted the 2-year PFS with HR of 0.33 (95% CI, 0.25–0.43; P <0.0001) and 0.53 (95% CI, 0.41-0.68; P <0.0001) for visual and Q/SQ methods, respectively (Fig. 3). .
Figure 2
Forest plot of the overall hazard ratio (HR) of the 2-Year Progression-Free
Survival. Squares Represent the HR of Each Single Study (Size of the Square
Reflects the Study-Specific Statistical Weight); Horizontal Lines Represent 95%
Confidence Intervals; Diamonds Represent the Pooled Estimates, Based on the
Random-Effects Meta-Analysis. SUVmax = Maximum Standardized Uptake Value
Reduction; SUVsum = Sum of Maximum Standardized Uptake Value Reduction.
Figure 3
Forest Plot of the Overall Hazard Ratio (HR) of the 2-Year Progression-Free
Survival According to the Interpretation Methods. Squares Represent the HR of
Each Single Study (Size of the Square Reflects the Study-Specific Statistical
Weight); Horizontal Lines Represent 95% Confidence Intervals; Diamonds Represent
the Pooled Estimates, Based on the Random-Effects Meta-Analysis. SUVmax =
Maximum Standardized Uptake Value Reduction; SUVsum = Sum of Maximum
Standardized Uptake Value Reduction.
We also analyzed the prognostic value of IFDG-PET as a function of the number of CTX cycles prior to IFDG-PET using random effects models. In studies where all patients received only 2 prior cycles, those with negative IFDG-PET demonstrated reduced risk of disease progression as compared with those who had positive results (HR = 0.43; 95% CI, 0.33-0.57; P <0.0001). In studies where patients received 4 or more cycles of prior CTX, an even lower HR was shown (HR = 0.29; 95% CI, 0.22-0.38; P <0.0001).
Examining Heterogeneity of HRs for PFS (Table 4)
A series of meta-regression analyses were carried out to explore heterogeneity. The explanatory variables tested in the univariate analyses were: study size, prospective versus retrospective design, patients’ median age, male-to-female ratio, stage III/IV to stage I/II ratio, IFDG-PET method (visual vs. Q/SQ), assessment (blinded vs. open), number of CTX cycles prior to IFDG-PET, and median follow-up. The multivariate random effects regression analysis demonstrated that higher study quality score, increasing median age, increasing number of prior CTX cycles, and longer follow-up were inversely associated with lower PFS HRs. Furthermore, visual methods were more related to lower HRs as compared with Q/SQ techniques.
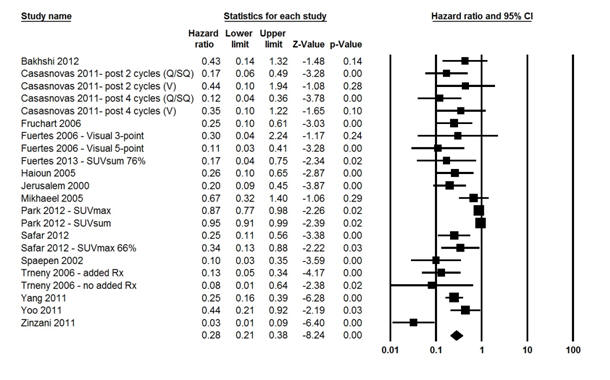
Figure 4 Forest Plot of the Overall Hazard Ratio (HR) of the 2-Year
Overall Survival. Squares Represent the HR of Each Single Study (Size of the
Square Reflects the Study-Specific Statistical Weight); Horizontal Lines
Represent 95% Confidence Intervals; Diamonds Represent the Pooled Estimates,
Based on the Random-Effects Meta-Analysis. SUVmax = Maximum Standardized Uptake
Value Reduction; SUVsum = Sum of Maximum Standardized Uptake Value Reduction.
Pooled HRs for Predicting OS
The fixed effects model for the 2-year OS showed significant heterogeneity (I2 statistic = 90.0%; P <0.0001); therefore, the random-effects model was computed and it showed that patients with negative IFDG-PET had 72% death risk reduction compared with those with positive studies (HR = 0.28; 95% CI, 0.21–0.38; P <0.0001) (Fig. 4). Moreover, in a random effects model, both visual and Q/SQ IFDG-PET methods significantly predicted the 2-year OS with HR of 0.22 (95% CI, 0.15–0.32; P <0.0001) and 0.61 (95% CI, 0.45-0.81; P <0.0001), respectively (Fig. 5).
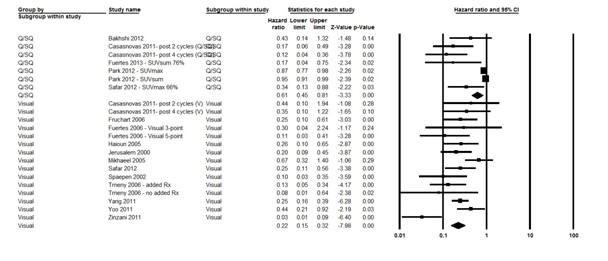
Figure 5 Forest Plot of the Overall Hazard Ratio (HR) of the 2-Year
Overall Survival According to the Interpretation Methods. Squares Represent the
HR of Each Single Study (Size of the Square Reflects the Study-Specific
Statistical Weight); Horizontal Lines Represent 95% Confidence Intervals;
Diamonds Represent the Pooled Estimates, Based on the Random-Effects
Meta-Analysis. SUVmax = Maximum Standardized Uptake Value Reduction; SUVsum =
Sum of Maximum Standardized Uptake Value Reduction.
In studies where all patients received only 2 prior CTX cycles, those with negative IFDG-PET demonstrated reduced risk of disease progression as compared with those who had positive results (HR = 0.43; 95% CI, 0.23-0.50; P <0.0001). Moreover, in studies where patients received 4 or more prior cycles, a lower HR was shown for patients with negative IFDG-PET compared with those with positive interim assessment (HR = 0.14; 95% CI, 0.09-0.23; P <0.0001).
Examining Heterogeneity of HRs for OS (Table 4)
To explore heterogeneity of the HRs in OS analyses, the same explanatory variables used in testing heterogeneity in HRs for PFS were also examined. For all studies, the multivariate random effects regression analysis demonstrated that higher stage III/IV to stage I/II ratios were inversely associated with lower OS HRs. Additionally, visual methods were more related to lower HRs as compared with Q/SQ interpretations.
Table
5 IFDG-PET Test
Performance on Predicting Progression-Free and Overall Survival
|
2-Year Progression-Free Survival
|
|
|
|
|
|
|
|
|
|
|
|
|
Mean
Sensitivity %
(95% CI)
|
Mean
Specificity %
(95% CI)
|
Mean
PPV %
(95% CI)
|
Mean
NPV %
(95% CI)
|
Mean
Likelihood + (95% CI)
|
Mean
Likelihood - (95% CI)
|
|
|
|
64.3
(32.7–96.7)
|
68.0
(41.9-87.9)
|
25.0
(2.9-45.0)
|
83.9
(80.9-87.5)
|
1.71
(1.05-2.78)
|
0.50
(0.17-0.90)
|
|
|
|
2-Year Progression-Free Survival: Area under curve
|
|
|
|
|
|
|
|
AUC
|
95% CI
|
Q*
|
|
|
|
|
|
IFDG-PET (both methods)
|
0.90
|
0.81 - 0.99
|
0.71
|
|
|
|
|
|
Visual
|
0.92
|
0.83 – 0.99
|
0.76
|
|
|
|
|
|
Q/SQ
|
0.81
|
0.47 – 1.00
|
0.45
|
|
|
|
|
|
|
|
|
|
|
|
|
|
|
|
|
2-Year Overall Survival
|
|
|
|
|
|
|
|
|
|
|
|
Mean
Sensitivity %
(95% CI)
|
Mean
Specificity %
(95% CI)
|
Mean
PPV %
(95% CI)
|
Mean
NPV %
(95% CI)
|
Mean
Likelihood + (95% CI)
|
Mean
Likelihood - (95% CI)
|
|
|
|
|
|
|
|
|
|
|
55.6
(10.9-99.3)
|
64.4
(44.0-84.8)
|
21.0
(4.0-61.9)
|
81.8
(69.4-94.1)
|
1.54
(0.87-2.20)
|
0.68
(0.18-.1.19)
|
|
2-Year Overall Survival – Area under
curve
|
|
|
|
|
AUC
|
95% CI
|
Q*
|
|
|
|
|
IFDG-PET (both methods)
|
0.88
|
0.66 – 1.00
|
0.50
|
|
|
|
Visual
|
0.89
|
0.60 – 1.00
|
0.50
|
|
|
|
Q/SQ
|
1.00
|
1.00 – 1.00
|
0.50
|
|
|
|
|
|
|
|
|
|
|
|
|
|
|
CI = confidence interval; IFDG-PET = interim 18F-2-deoxy-2-fluoro-D-glucose
positron emission tomography; NPV = negative predictive value; PPV = positive
predictive value; Q/SQ = quantitative/semi-quantitative.
Examining the Influence of Blinding Interpretation from Clinical Outcome
Examination of the effect of blinding assessment of IFDG-PET in the 10 studies where blinding was required showed a higher pooled PFS HR as compared with that derived from studies where blinding was not applied (HR = 0.42; 95% CI, 0.32-0.55 vs. HR = 0.34; 95% CI, 0.25-0.45, respectively). Additionally, a higher pooled OS HR was shown for blinded versus open interpretations (HR = 0.40; 95% CI, 0.29-0.54 vs. HR = 0.17; 95% CI, 0.08-0.54, respectively).p>
Testing Performance of IFDG-PET
The predicting performance of IFDG-PET was extracted or computed from several studies (10-13, 15, 16, 32, 34, 35, 37-41, 43, 45). Table 5 s shows that IFDG-PET demonstrated moderate sensitivity and specificity for predicting the 2-year PFS (61.8% and 66.0 %, respectively), and OS (62.0% and 63.0%, respectively). On the other hand, while the NPVs for PFS (82.6 %) and OS (85.1%) were high, the NPVs were low (24.8% and 18.9%, respectively). Moreover, the positive LRs for PFS and OS were higher (2.69 and 2.1, respectively) than the negative LRs (0.65 and 0.61, respectively).
Table 5 also shows that for predicting PFS, the AUC for IFDG-PET was larger for visual versus Q/SQ interpretations (0.92 and 0.81, respectively). Moreover, the Q* (global measure of diagnostic accuracy) was also higher for visual versus Q/SQ methods (0.76 vs. 0.45, respectively). On the other hand, predicting OS using visual methods was associated with a high AUC (0.89), with a modest Q* (0.50). For Q/SQ methods, the AUC for predicting OS was 1.00 with moderate Q* (0.50).
Discussion
The present meta-analysis that included a large cohort of 1,957 patients with NHL of whom 95% had DLBC, showed that IFDG-PET can successfully predict survival. The pooled analyses showed that patients with negative IFDG-PET had 62% reduction risk of disease progression and 72% reduction risk of death compared with those with positive IFDG-PET. p>
However, it was not expected that the visual images interpretation would be more predictive of PFS and OS than Q/SQ assessment. However, notably the included Q/SQ studies have used different cutoff values for the maximum standardized uptake value reduction and the sum of maximum standardized uptake value reduction. It is known that FDG-PET image quality depends on many factors including scanner type, administered dose, acquisition protocol, and image reconstruction parameters. Several groups have proposed successful frameworks for standardization of the imaging parameters by optimizing acquisition and reconstruction variables [17, 48, 49]. Future prospective trials designed to address the predictive role of IFDG-PET and the impact of risk-adaptation guided by the results should use proven standardized guidelines and protocols.
One of the interesting outcomes of the current meta-analysis was the demonstrated predictive value of IFDG-PET regardless of the number of prior CTX cycles, albeit, with more predictability in those receiving 4 or more prior cycles. In one study of 30 patients (17 NHL and 13 HL), IFDG-PET was predictive of PFS after only one cycle of CTX (31). The latter study also showed that the PFS and interim images correlated better than those obtained after the completion of chemotherapy. This outcome, however, may have been confounded by the small sample size and the inclusion of patients with both NHL and HL. It seems more appropriate, therefore, to assess IFDG-PET after at least 2 cycles and rather after 4 cycles of the planned treatment.
Investigating HRs heterogeneity in the analysis of PFS using several sets of meta-regressions, showed that study quality score, patients’ median age, number of prior CTX, the length of follow-up, and interpretation models could explained the demonstrated heterogeneity. On the other hand, for OS analysis, the multivariate random effects regression analysis showed that stage III/IV to stage I/II ratios and IFDG-PET methods contributed to the detected heterogeneity.
Examination of the pooled test performance of IFDG-PET showed moderate sensitivity and specificity for predicting PFS (64.3% and 68%, respectively), and OS (55.6% and 64.4%, respectively). That demonstrated sensitivity is lower than expected considering the known high sensitivity of FDG-PET in DLBC NHL. In a study that classified 766 cases of lymphoma as FDG-avid or FDG-non-avid lymphoma, the diagnostic sensitivity of FDG-PET was 97% for DLBCL 97% (50). Moreover, in the meta-analysis that included 854 patients with NHL and HL, it was shown that PET had pooled diagnostic sensitivity of 89.4% and specificity of 87.6% based on the analysis of 6 studies of patients with NHL (18). Of note, however, that the meta-analysis included patients with different NHL histologic subtypes.
Furthermore, the current meta-analysis showed that IFDG-PET demonstrated high NPV and low PPV for projecting PFS and OS. The high NPV is in keeping with the high NPV of greater than 80% in nearly all the reported studies (3, 5, 6). On the other hand, the low PPV for predicting PFS (25%) and OS (21%) was disappointing as it indicates false positive rates of 75-79%. Of note, however, that estimating interim images test performance was only possible from 16 of the 22 included studies. Analysis of PFS also showed that visual methods outperformed Q/SQ interpretations with larger AUC and higher Q* value. For the analysis of OS, both interpretation methods were associated with modest Q*.
The present meta-analysis has certain limitations. First, despite the acceptable quality score of the included studies, there were several limitations related to the study designs used. Thirty-six percent of the studies were retrospective and in 50% of the studies, image interpretation was made without blinding from clinical outcomes with a trend of lower HRs with open interpretations. Moreover, in only 15% of the studies the results of IFDG-PET influenced further management. The lack of such studies that randomize patients to management strategies with versus without IFDG-PET is a limitation of the currently available evidence. Second, in studies that used Q/SQ methods, there was significant evidence of publication bias. Moreover, in these studies varied Q/SQ methods have been used that may have affected the conclusions about the predictive utility of such techniques. On the contrary, studies using visual methods were more homogenous and did not show significant publication bias.
Third, the presence of clinical heterogeneity originated by the inclusion of patients at different stages of disease and other clinical characteristics may affect the generalizability of the results (51). However, the comprehensive meta-regression analyses that we have performed have attempted to explain this heterogeneity. Fourth, there was a variability of timing of IFDG-PET; however, the meta-analysis demonstrated the predictive clinical utility of IFDG-PET regardless of the number of cycles given prior to interim evaluation. Finally, there were only two studies where patients with a positive IFDG-PET underwent routine biopsy. However, the reported false positive rates varied considerably (13% (16) and 80% (37)).
Conclusions
In conclusion, the rationale for IFDG-PET is based on the hypothesis that it is a precise predictor of the final outcome. The current meta-analysis supported that concept and it showed that response to initiated treatment serves as a surrogate for the other more clinically important parameters, i.e., PFS and OS. Aggressive NHL patients who respond poorly to first-line treatment or relapse could benefit from early recognition of the treatment failure. Therefore, a negative IFDG-PET should support continuation of current therapy or even less intensive regimen, while positive IFDG-PET may suggest the need for more intensive treatment strategies. Nevertheless, there is no adequate evidence that substantiate the validity of such approach. At present there are multiple ongoing clinical trials using IFDG-PET response-adaptive therapy (52). If the derived data of these clinical PET studies proved the notion, IFDG-PET would play a significant role in clinical practice.
Conflict of Interests
All authors declare no conflict of interest
Authors’ Contribution
MMA: Conceptual design, Literature review, preparation of the draft and approval of the final manuscript.MA: Conceptual design, Literature review, preparation of the draft and approval of the final manuscript.GAK: Conceptual design, Literature review, preparation of the draft and approval of the final manuscript.EMI: Conceptual design, Statistical analysis, preparation of the draft and approval of the final manuscript.
Funding
None
Acknowledgement
None declared
References
[1] Fletcher JW, Djulbegovic B, Soares HP, Siegel BA, Lowe VJ, Lyman GH, et al. Recommendations on the use of 18F-FDG PET in oncology. Journal of nuclear medicine : official publication, Society of Nuclear Medicine. 2008;49(3):480-508. Epub 2008/02/22. doi: 10.2967/jnumed.107.047787. PubMed PMID: 18287273.
[2] Scheibler F, Zumbe P, Janssen I, Viebahn M, Schroer-Gunther M, Grosselfinger R, et al. Randomized controlled trials on PET: a systematic review of topics, design, and quality. Journal of nuclear medicine : official publication, Society of Nuclear Medicine. 2012;53(7):1016-1025. Epub 2012/06/09. doi: 10.2967/jnumed.111.101089. PubMed PMID: 22677702.
[3] Zijlstra JM, Lindauer-van der Werf G, Hoekstra OS, Hooft L, Riphagen, II, Huijgens PC. 18F-fluoro-deoxyglucose positron emission tomography for post-treatment evaluation of malignant lymphoma: a systematic review. Haematologica. 2006;91(4):522-529. Epub 2006/04/06. PubMed PMID: 16585017.
[4]Terasawa T, Nihashi T, Hotta T, Nagai H. 18F-FDG PET for posttherapy assessment of Hodgkin's disease and aggressive Non-Hodgkin's lymphoma: a systematic review. Journal of nuclear medicine : official publication, Society of Nuclear Medicine. 2008;49(1):13-21. Epub 2007/12/14. doi: 10.2967/jnumed.107.039867. PubMed PMID: 18077527.
[5]Cheson BD, Pfistner B, Juweid ME, Gascoyne RD, Specht L, Horning SJ, et al. Revised response criteria for malignant lymphoma. Journal of clinical oncology : official journal of the American Society of Clinical Oncology. 2007;25(5):579-586. Epub 2007/01/24. doi: 10.1200/JCO.2006.09.2403. PubMed PMID: 17242396.
[6]Juweid ME, Stroobants S, Hoekstra OS, Mottaghy FM, Dietlein M, Guermazi A, et al. Use of positron emission tomography for response assessment of lymphoma: consensus of the Imaging Subcommittee of International Harmonization Project in Lymphoma. Journal of clinical oncology : official journal of the American Society of Clinical Oncology. 2007;25(5):571-578. Epub 2007/01/24. doi: 10.1200/JCO.2006.08.2305. PubMed PMID: 17242397.
[7]Romano A, Vetro C, Donnarumma D, Forte S, Ippolito M, Di Raimondo F. Early interim 2-(1)fluoro-2-deoxy-D-glucose positron emission tomography is prognostically superior to peripheral blood lymphocyte/monocyte ratio at diagnosis in classical Hodgkin's lymphoma. Haematologica. 2012;97(6):e21-23; author reply e24. Epub 2012/06/06. doi: 10.3324/haematol.2012.064576. PubMed PMID: 22665531; PubMed Central PMCID: PMC3366667.
[8]Orlacchio A, Schillaci O, Gaspari E, Della Gatta F, Danieli R, Bolacchi F, et al. Role of [18F]-FDG-PET/MDCT in evaluating early response in patients with Hodgkin's lymphoma. La Radiologia medica. 2012;117(7):1250-1263. Epub 2012/02/14. doi: 10.1007/s11547-012-0792-8. PubMed PMID: 22327919.
[9]Kasamon YL. Prognostication and Risk-Adapted Therapy of Hodgkin's Lymphoma Using Positron Emission Tomography. Advances in hematology. 2011;2011:271595. Epub 2011/01/22. doi: 10.1155/2011/271595. PubMed PMID: 21253532; PubMed Central PMCID: PMC3021845.
[10]Spaepen K, Stroobants S, Dupont P, Vandenberghe P, Thomas J, de Groot T, et al. Early restaging positron emission tomography with ( 18)F-fluorodeoxyglucose predicts outcome in patients with aggressive non-Hodgkin's lymphoma. Annals of oncology : official journal of the European Society for Medical Oncology / ESMO. 2002;13(9):1356-1363. Epub 2002/08/28. PubMed PMID: 12196360.
[11] Jerusalem G, Beguin Y, Fassotte MF, Najjar F, Paulus P, Rigo P, et al. Persistent tumor 18F-FDG uptake after a few cycles of polychemotherapy is predictive of treatment failure in non-Hodgkin's lymphoma. Haematologica. 2000;85(6):613-618. Epub 2000/06/28. PubMed PMID: 10870118.
[12]Mikhaeel NG, Hutchings M, Fields PA, O'Doherty MJ, Timothy AR. FDG-PET after two to three cycles of chemotherapy predicts progression-free and overall survival in high-grade non-Hodgkin lymphoma. Annals of oncology : official journal of the European Society for Medical Oncology / ESMO. 2005;16(9):1514-1523. Epub 2005/06/28. doi: 10.1093/annonc/mdi272. PubMed PMID: 15980161.
[13]Haioun C, Itti E, Rahmouni A, Brice P, Rain JD, Belhadj K, et al. [18F]fluoro-2-deoxy-D-glucose positron emission tomography (FDG-PET) in aggressive lymphoma: an early prognostic tool for predicting patient outcome. Blood. 2005;106(4):1376-1381. Epub 2005/04/30. doi: 10.1182/blood-2005-01-0272. PubMed PMID: 15860666.
[14] Hutchings M, Mikhaeel NG, Fields PA, Nunan T, Timothy AR. Prognostic value of interim FDG-PET after two or three cycles of chemotherapy in Hodgkin lymphoma. Annals of oncology : official journal of the European Society for Medical Oncology / ESMO. 2005;16(7):1160-1168. Epub 2005/06/09. doi: 10.1093/annonc/mdi200. PubMed PMID: 15939713.
[15]Pregno P, Chiappella A, Bello M, Botto B, Ferrero S, Franceschetti S, et al. Interim 18-FDG-PET/CT failed to predict the outcome in diffuse large B-cell lymphoma patients treated at the diagnosis with rituximab-CHOP. Blood. 2012;119(9):2066-2073. Epub 2012/01/12. doi: 10.1182/blood-2011-06-359943. PubMed PMID: 22234681.
[16]Moskowitz CH, Schoder H, Teruya-Feldstein J, Sima C, Iasonos A, Portlock CS, et al. Risk-adapted dose-dense immunochemotherapy determined by interim FDG-PET in Advanced-stage diffuse large B-Cell lymphoma. Journal of clinical oncology : official journal of the American Society of Clinical Oncology. 2010;28(11):1896-1903. Epub 2010/03/10. doi: 10.1200/JCO.2009.26.5942. PubMed PMID: 20212248.
[17] Zijlstra JM, Boellaard R, Hoekstra OS. Interim positron emission tomography scan in multi-center studies: optimization of visual and quantitative assessments. Leukemia & lymphoma. 2009;50(11):1748-1749. Epub 2009/10/30. doi: 10.3109/10428190903308049. PubMed PMID: 19863171.
[18]Isasi CR, Lu P, Blaufox MD. A metaanalysis of 18F-2-deoxy-2-fluoro-D-glucose positron emission tomography in the staging and restaging of patients with lymphoma. Cancer. 2005;104(5):1066-1074. Epub 2005/07/28. doi: 10.1002/cncr.21253. PubMed PMID: 16047335.
[19]Gould MK, Kuschner WG, Rydzak CE, Maclean CC, Demas AN, Shigemitsu H, et al. Test performance of positron emission tomography and computed tomography for mediastinal staging in patients with non-small-cell lung cancer: a meta-analysis. Annals of internal medicine. 2003;139(11):879-892. Epub 2003/12/04. PubMed PMID: 14644890.
[20] Schelbert HR, Hoh CK, Royal HD, Brown M, Dahlbom MN, Dehdashti F, et al. Procedure guideline for tumor imaging using fluorine-18-FDG. Society of Nuclear Medicine. Journal of nuclear medicine : official publication, Society of Nuclear Medicine. 1998;39(7):1302-1305. Epub 1998/07/21. PubMed PMID: 9669415.
[21]Tierney JF, Stewart LA, Ghersi D, Burdett S, Sydes MR. Practical methods for incorporating summary time-to-event data into meta-analysis. Trials. 2007;8:16. Epub 2007/06/09. doi: 10.1186/1745-6215-8-16. PubMed PMID: 17555582; PubMed Central PMCID: PMC1920534.
[22]Parmar MK, Torri V, Stewart L. Extracting summary statistics to perform meta-analyses of the published literature for survival endpoints. Statistics in medicine. 1998;17(24):2815-2834. Epub 1999/01/28. PubMed PMID: 9921604.
[23]Florkowski CM. Sensitivity, Specificity, Receiver-Operating Characteristic (ROC) Curves and Likelihood Ratios: Communicating the Performance of Diagnostic Tests. The Clinical Biochemist Reviews. 2008;29(Supplement (i)):S83-87. PubMed PMID: 18852864.
[24]Moses LE, Shapiro D, Littenberg B. Combining independent studies of a diagnostic test into a summary ROC curve: data-analytic approaches and some additional considerations. Statistics in medicine. 1993;12(14):1293-1316. Epub 1993/07/30. PubMed PMID: 8210827.
[25] Higgins JP, Thompson SG. Quantifying heterogeneity in a meta-analysis. Statistics in medicine. 2002;21(11):1539-1558. Epub 2002/07/12. doi: 10.1002/sim.1186. PubMed PMID: 12111919. [Pubmed]
[26]Higgins JP, Thompson SG, Deeks JJ, Altman DG. Measuring inconsistency in meta-analyses. BMJ. 2003;327(7414):557-560. Epub 2003/09/06. doi: 10.1136/bmj.327.7414.557. PubMed PMID: 12958120; PubMed Central PMCID: PMC192859.
[27] Donders AR, van der Heijden GJ, Stijnen T, Moons KG. Review: a gentle introduction to imputation of missing values. Journal of clinical epidemiology. 2006;59(10):1087-1091. Epub 2006/09/19. doi: 10.1016/j.jclinepi.2006.01.014. PubMed PMID: 16980149.
[28]Egger M, Davey Smith G, Schneider M, Minder C. Bias in meta-analysis detected by a simple, graphical test. BMJ. 1997;315(7109):629-634. Epub 1997/10/06. PubMed PMID: 9310563; PubMed Central PMCID: PMC2127453.
[29] Sharma P, Gupta A, Patel C, Bakhshi S, Malhotra A, Kumar R. Pediatric lymphoma: metabolic tumor burden as a quantitative index for treatment response evaluation. Annals of nuclear medicine. 2012;26(1):58-66. Epub 2011/10/29. doi: 10.1007/s12149-011-0539-2. PubMed PMID: 22033780.
[30] Schot B, van Imhoff G, Pruim J, Sluiter W, Vaalburg W, Vellenga E. Predictive value of early 18F-fluoro-deoxyglucose positron emission tomography in chemosensitive relapsed lymphoma. Br J Haematol. 2003;123(2):282-287. Epub 2003/10/09. PubMed PMID: 14531910.
[31]Kostakoglu L, Coleman M, Leonard JP, Kuji I, Zoe H, Goldsmith SJ. PET predicts prognosis after 1 cycle of chemotherapy in aggressive lymphoma and Hodgkin's disease. Journal of nuclear medicine : official publication, Society of Nuclear Medicine. 2002;43(8):1018-1027. Epub 2002/08/07. PubMed PMID: 12163626. [Pubmed]
[32] Fruchart C, Reman O, Le Stang N, Musafiri D, Cheze S, Macro M, et al. Prognostic value of early 18 fluorodeoxyglucose positron emission tomography and gallium-67 scintigraphy in aggressive lymphoma: a prospective comparative study. Leukemia & lymphoma. 2006;47(12):2547-2557. Epub 2006/12/16. doi: 10.1080/10428190600942959. PubMed PMID: 17169799. [Pubmed]
[33] Trneny M, Jaeger U, Belohlavek O, Skrabs C, Koren J, Hanswirth A, et al. Prediction of outcome using positron emission tomography (PET) compared to standard response criteria and potential role in treatment decisions in diffuse large B-cell lymphoma (DLBCL) patients. ASCO Meeting Abstracts. 2006;24(18_suppl):7565.
[34]Dupuis J, Itti E, Rahmouni A, Hemery F, Gisselbrecht C, Lin C, et al. Response assessment after an inductive CHOP or CHOP-like regimen with or without rituximab in 103 patients with diffuse large B-cell lymphoma: integrating 18fluorodeoxyglucose positron emission tomography to the International Workshop Criteria. Annals of oncology : official journal of the European Society for Medical Oncology / ESMO. 2009;20(3):503-507. Epub 2008/12/17. doi: 10.1093/annonc/mdn671. PubMed PMID: 19074215. [Pubmed]
[35]Halasz LM, Jacene HA, Catalano PJ, Van den Abbeele AD, Lacasce A, Mauch PM, et al. Combined modality treatment for PET-positive non-Hodgkin lymphoma: favorable outcomes of combined modality treatment for patients with non-Hodgkin lymphoma and positive interim or postchemotherapy FDG-PET. International journal of radiation oncology, biology, physics. 2012;83(5):e647-654. Epub 2012/05/23. doi: 10.1016/j.ijrobp.2012.01.060. PubMed PMID: 22607911. [Pubmed]
[36] Itti E, Juweid ME, Haioun C, Yeddes I, Hamza-Maaloul F, El Bez I, et al. Improvement of early 18F-FDG PET interpretation in diffuse large B-cell lymphoma: importance of the reference background. Journal of nuclear medicine : official publication, Society of Nuclear Medicine. 2010;51(12):1857-1862. Epub 2010/11/17. doi: 10.2967/jnumed.110.080556. PubMed PMID: 21078789. [Pubmed]
[37] Casasnovas RO, Meignan M, Berriolo-Riedinger A, Bardet S, Julian A, Thieblemont C, et al. SUVmax reduction improves early prognosis value of interim positron emission tomography scans in diffuse large B-cell lymphoma. Blood. 2011;118(1):37-43. Epub 2011/04/27. doi: 10.1182/blood-2010-12-327767. PubMed PMID: 21518924. [Pubmed]
[38]Cashen AF, Dehdashti F, Luo J, Homb A, Siegel BA, Bartlett NL. 18F-FDG PET/CT for early response assessment in diffuse large B-cell lymphoma: poor predictive value of international harmonization project interpretation. Journal of nuclear medicine : official publication, Society of Nuclear Medicine. 2011;52(3):386-392. Epub 2011/02/16. doi: 10.2967/jnumed.110.082586. PubMed PMID: 21321279. [Pubmed]
[39] Yang DH, Min JJ, Song HC, Jeong YY, Chung WK, Bae SY, et al. Prognostic significance of interim (1)(8)F-FDG PET/CT after three or four cycles of R-CHOP chemotherapy in the treatment of diffuse large B-cell lymphoma. Eur J Cancer. 2011;47(9):1312-1318. Epub 2011/02/22. doi: 10.1016/j.ejca.2010.12.027. PubMed PMID: 21334197. [Pubmed]
[40]Yoo C, Lee DH, Kim JE, Jo J, Yoon DH, Sohn BS, et al. Limited role of interim PET/CT in patients with diffuse large B-cell lymphoma treated with R-CHOP. Annals of hematology. 2011;90(7):797-802. Epub 2010/12/25. doi: 10.1007/s00277-010-1135-6. PubMed PMID: 21181163. [Pubmed]
[41]Bakhshi S, Radhakrishnan V, Sharma P, Kumar R, Thulkar S, Vishnubhatla S, et al. Pediatric nonlymphoblastic non-Hodgkin lymphoma: baseline, interim, and posttreatment PET/CT versus contrast-enhanced CT for evaluation--a prospective study. Radiology. 2012;262(3):956-968. Epub 2012/02/24. doi: 10.1148/radiol.11110936. PubMed PMID: 22357895. [Pubmed]
[42]Park S, Moon SH, Park LC, Hwang DW, Ji JH, Maeng CH, et al. The impact of baseline and interim PET/CT parameters on clinical outcome in patients with diffuse large B cell lymphoma. American journal of hematology. 2012;87(9):937-940. Epub 2012/06/26. doi: 10.1002/ajh.23267. PubMed PMID: 22730093. [Pubmed]
[43] Safar V, Dupuis J, Itti E, Jardin F, Fruchart C, Bardet S, et al. Interim [18F]fluorodeoxyglucose positron emission tomography scan in diffuse large B-cell lymphoma treated with anthracycline-based chemotherapy plus rituximab. Journal of clinical oncology : official journal of the American Society of Clinical Oncology. 2012;30(2):184-190. Epub 2011/12/14. doi: 10.1200/JCO.2011.38.2648. PubMed PMID: 22162590. [Pubmed]
[44] Yang DH, Ahn JS, Byun BH, Min JJ, Kweon SS, Chae YS, et al. Interim PET/CT-based prognostic model for the treatment of diffuse large B cell lymphoma in the post-rituximab era. Annals of hematology. 2012. Epub 2012/12/15. doi: 10.1007/s00277-012-1640-x. PubMed PMID: 23238895. [Pubmed]
[45]Fuertes S, Setoain X, Lopez-Guillermo A, Carrasco JL, Rodriguez S, Rovira J, et al. Interim FDG PET/CT as a prognostic factor in diffuse large B-cell lymphoma. European journal of nuclear medicine and molecular imaging. 2013. Epub 2013/01/25. doi: 10.1007/s00259-012-2320-8. PubMed PMID: 23344136. [Pubmed]
[46]Zinzani PL, Gandolfi L, Broccoli A, Argnani L, Fanti S, Pellegrini C, et al. Midtreatment 18F-fluorodeoxyglucose positron-emission tomography in aggressive non-Hodgkin lymphoma. Cancer. 2011;117(5):1010-1018. Epub 2010/10/21. doi: 10.1002/cncr.25579. PubMed PMID: 20960498. [Pubmed]
[47] Ying Z, Wang X, Song Y, Zheng W, Xie Y, Lin N, et al. Prognostic value of interim (18)F-FDG PET/CT in diffuse large B-cell lymphoma. Chin J Cancer Res. 2013;25(1):95-101. Epub 2013/02/02. doi: 10.3978/j.issn.1000-9604.2013.01.08. PubMed PMID: 23372347; PubMed Central PMCID: PMC3555293. [Pubmed]
[48]Scheuermann JS, Saffer JR, Karp JS, Levering AM, Siegel BA. Qualification of PET scanners for use in multicenter cancer clinical trials: the American College of Radiology Imaging Network experience. Journal of nuclear medicine : official publication, Society of Nuclear Medicine. 2009;50(7):1187-1193. Epub 2009/06/16. doi: 10.2967/jnumed.108.057455. PubMed PMID: 19525463; PubMed Central PMCID: PMC2744888. [Pubmed]
[49]Daisaki H, Tateishi U, Terauchi T, Tatsumi M, Suzuki K, Shimada N, et al. Standardization of image quality across multiple centers by optimization of acquisition and reconstruction parameters with interim FDG-PET/CT for evaluating diffuse large B cell lymphoma. Annals of nuclear medicine. 2012. Epub 2012/12/25. doi: 10.1007/s12149-012-0676-2. PubMed PMID: 23264065. [Pubmed]
[50] Weiler-Sagie M, Bushelev O, Epelbaum R, Dann EJ, Haim N, Avivi I, et al. (18)F-FDG avidity in lymphoma readdressed: a study of 766 patients. Journal of nuclear medicine : official publication, Society of Nuclear Medicine. 2010;51(1):25-30. Epub 2009/12/17. doi: 10.2967/jnumed.109.067892. PubMed PMID: 20009002. [Pubmed]
[51] Irwig L, Macaskill P, Glasziou P, Fahey M. Meta-analytic methods for diagnostic test accuracy. Journal of clinical epidemiology. 1995;48(1):119-130; discussion 131-112. Epub 1995/01/01. PubMed PMID: 7853038. [Pubmed]
[52] Baba S, Abe K, Isoda T, Maruoka Y, Sasaki M, Honda H. Impact of FDG-PET/CT in the management of lymphoma. Annals of nuclear medicine. 2011;25(10):701-716. Epub 2011/11/01. doi: 10.1007/s12149-011-0549-0. PubMed PMID: 22037934. [Pubmed]